AI Streetscape Analysis
Computer Vision applications for analyzing urban street quality and walkability.
Context & Pain Points
- Macro Background: As China's urban development transitions from incremental expansion to stock renewal, the micro-renewal of old urban areas has become key to high-quality urban development. Concurrently, the national "14th Five-Year Plan" explicitly states that urban construction must shift from "object-oriented" to "people-centered and health-oriented".
- Business Pain Points: Constrained by its complex historical evolution, Guangzhou's old urban areas face severe health and spatial supply challenges, such as aging infrastructure, severe functional decline, and traffic congestion. Considering that rail transit accounts for over 44% of Guangzhou's public transit passenger flow, and "walking" is the core way for residents in old urban areas to connect to the subway, the deterioration of the walking environment directly impacts urban operational efficiency.
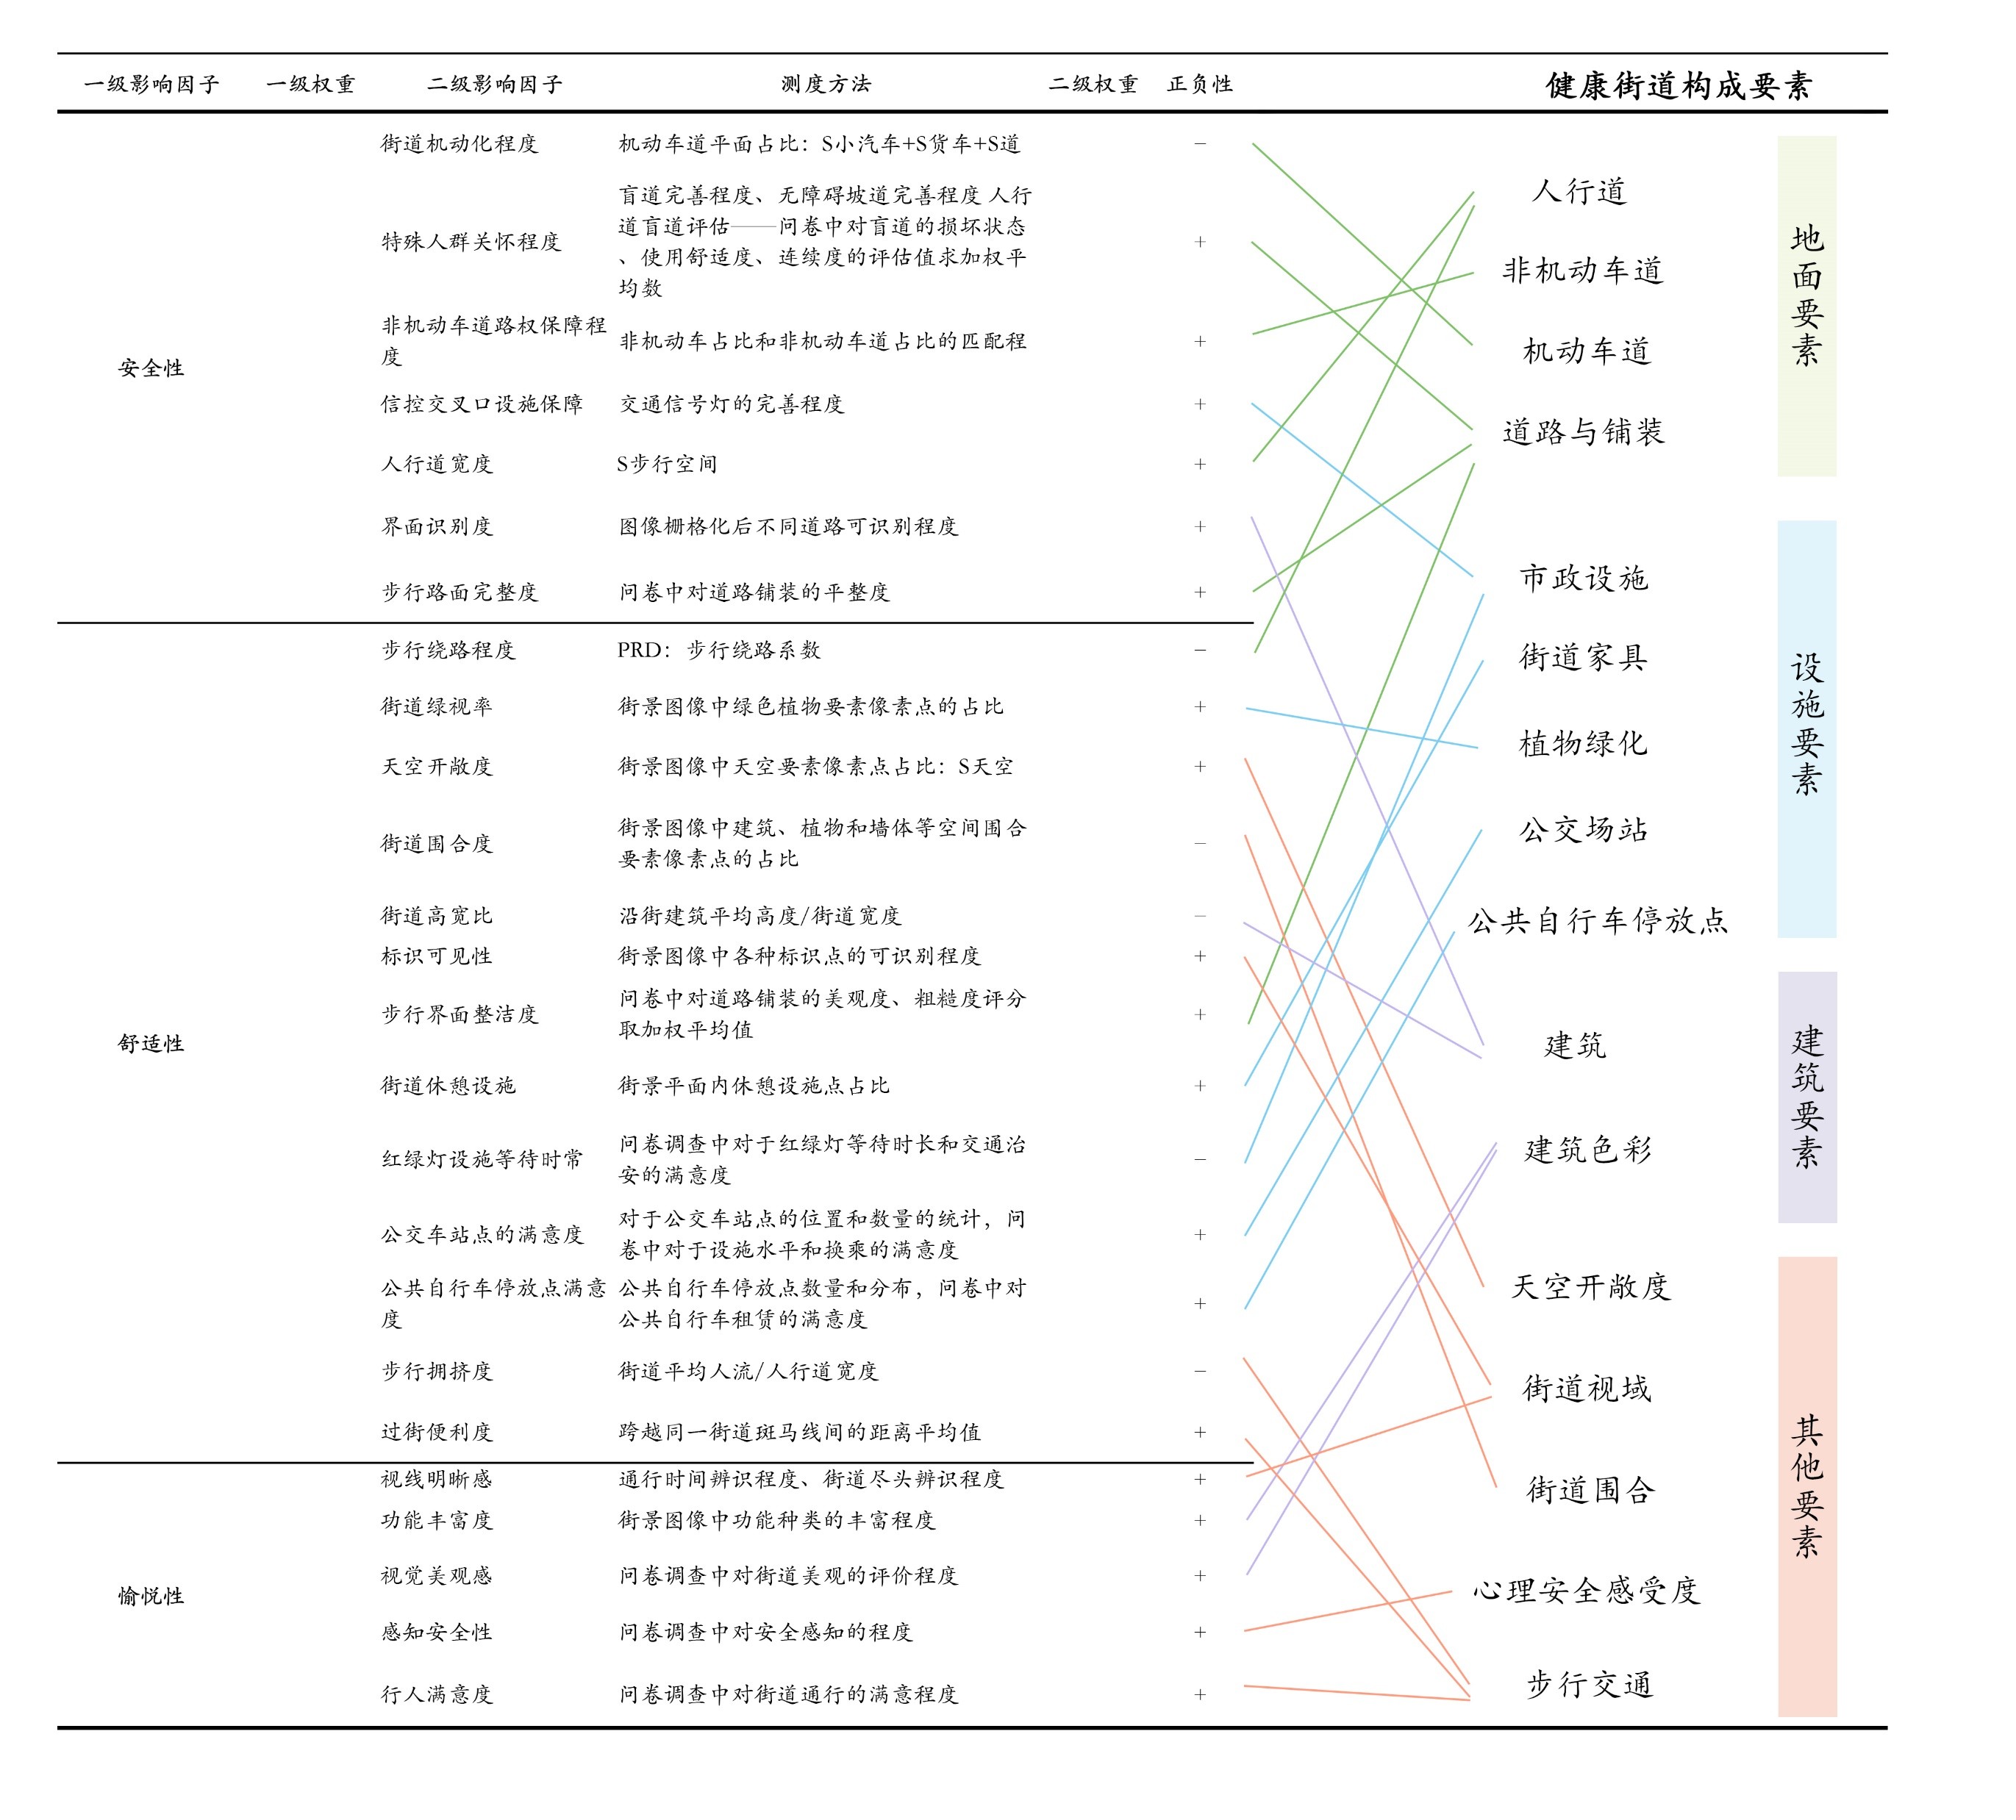
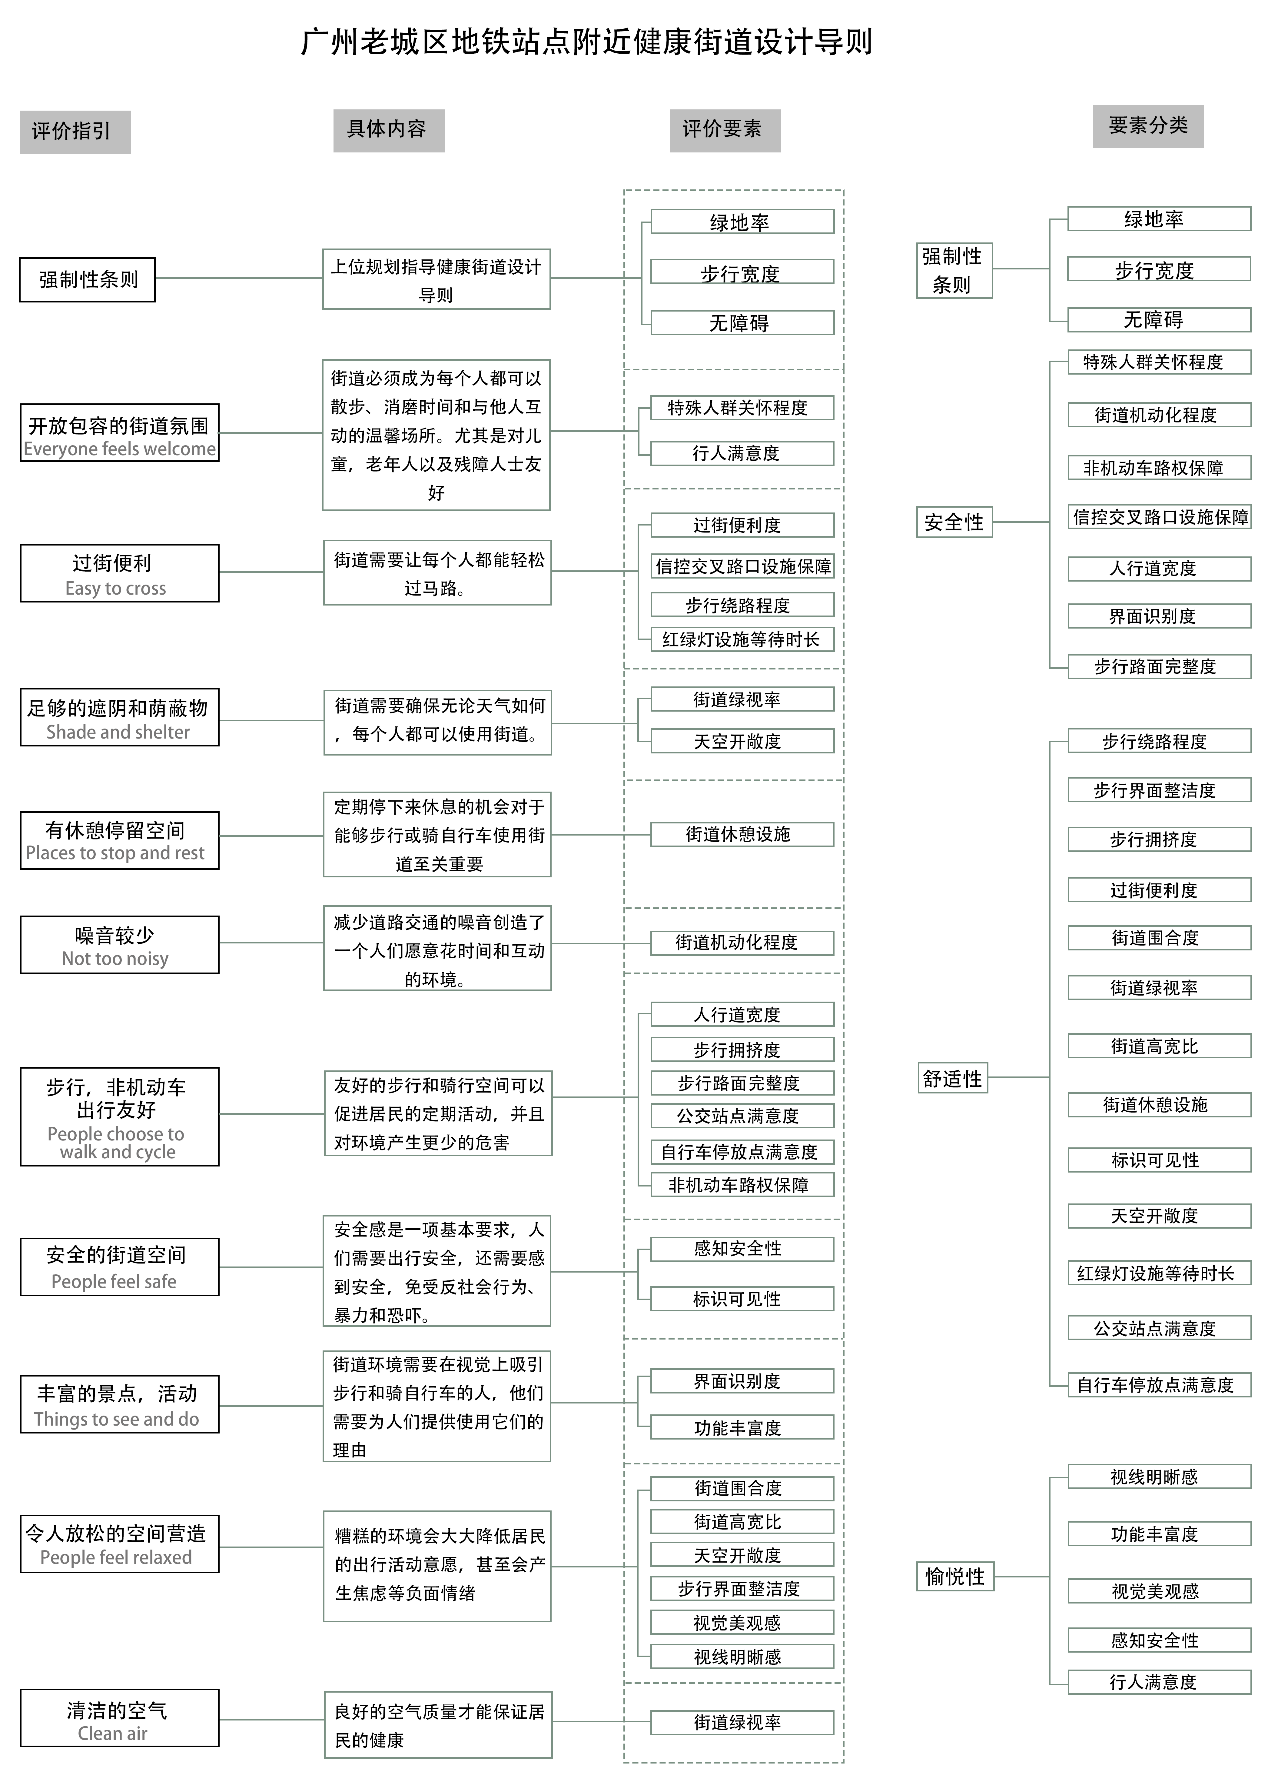
- Research Anchor: Introducing the cutting-edge concept of "Healthy Streets", focusing on three core obstacles to walking: traffic noise, air pollution, and lack of a convenient walking environment. Since traditional urban micro-renewal research heavily relies on subjective questionnaires and lacks objective data support, this project broke the traditional black box to introduce multi-source objective data for precise quantitative diagnosis of micro-spaces within a 10-minute walking radius (approx. 500 meters) around core subway stations.
Objectives
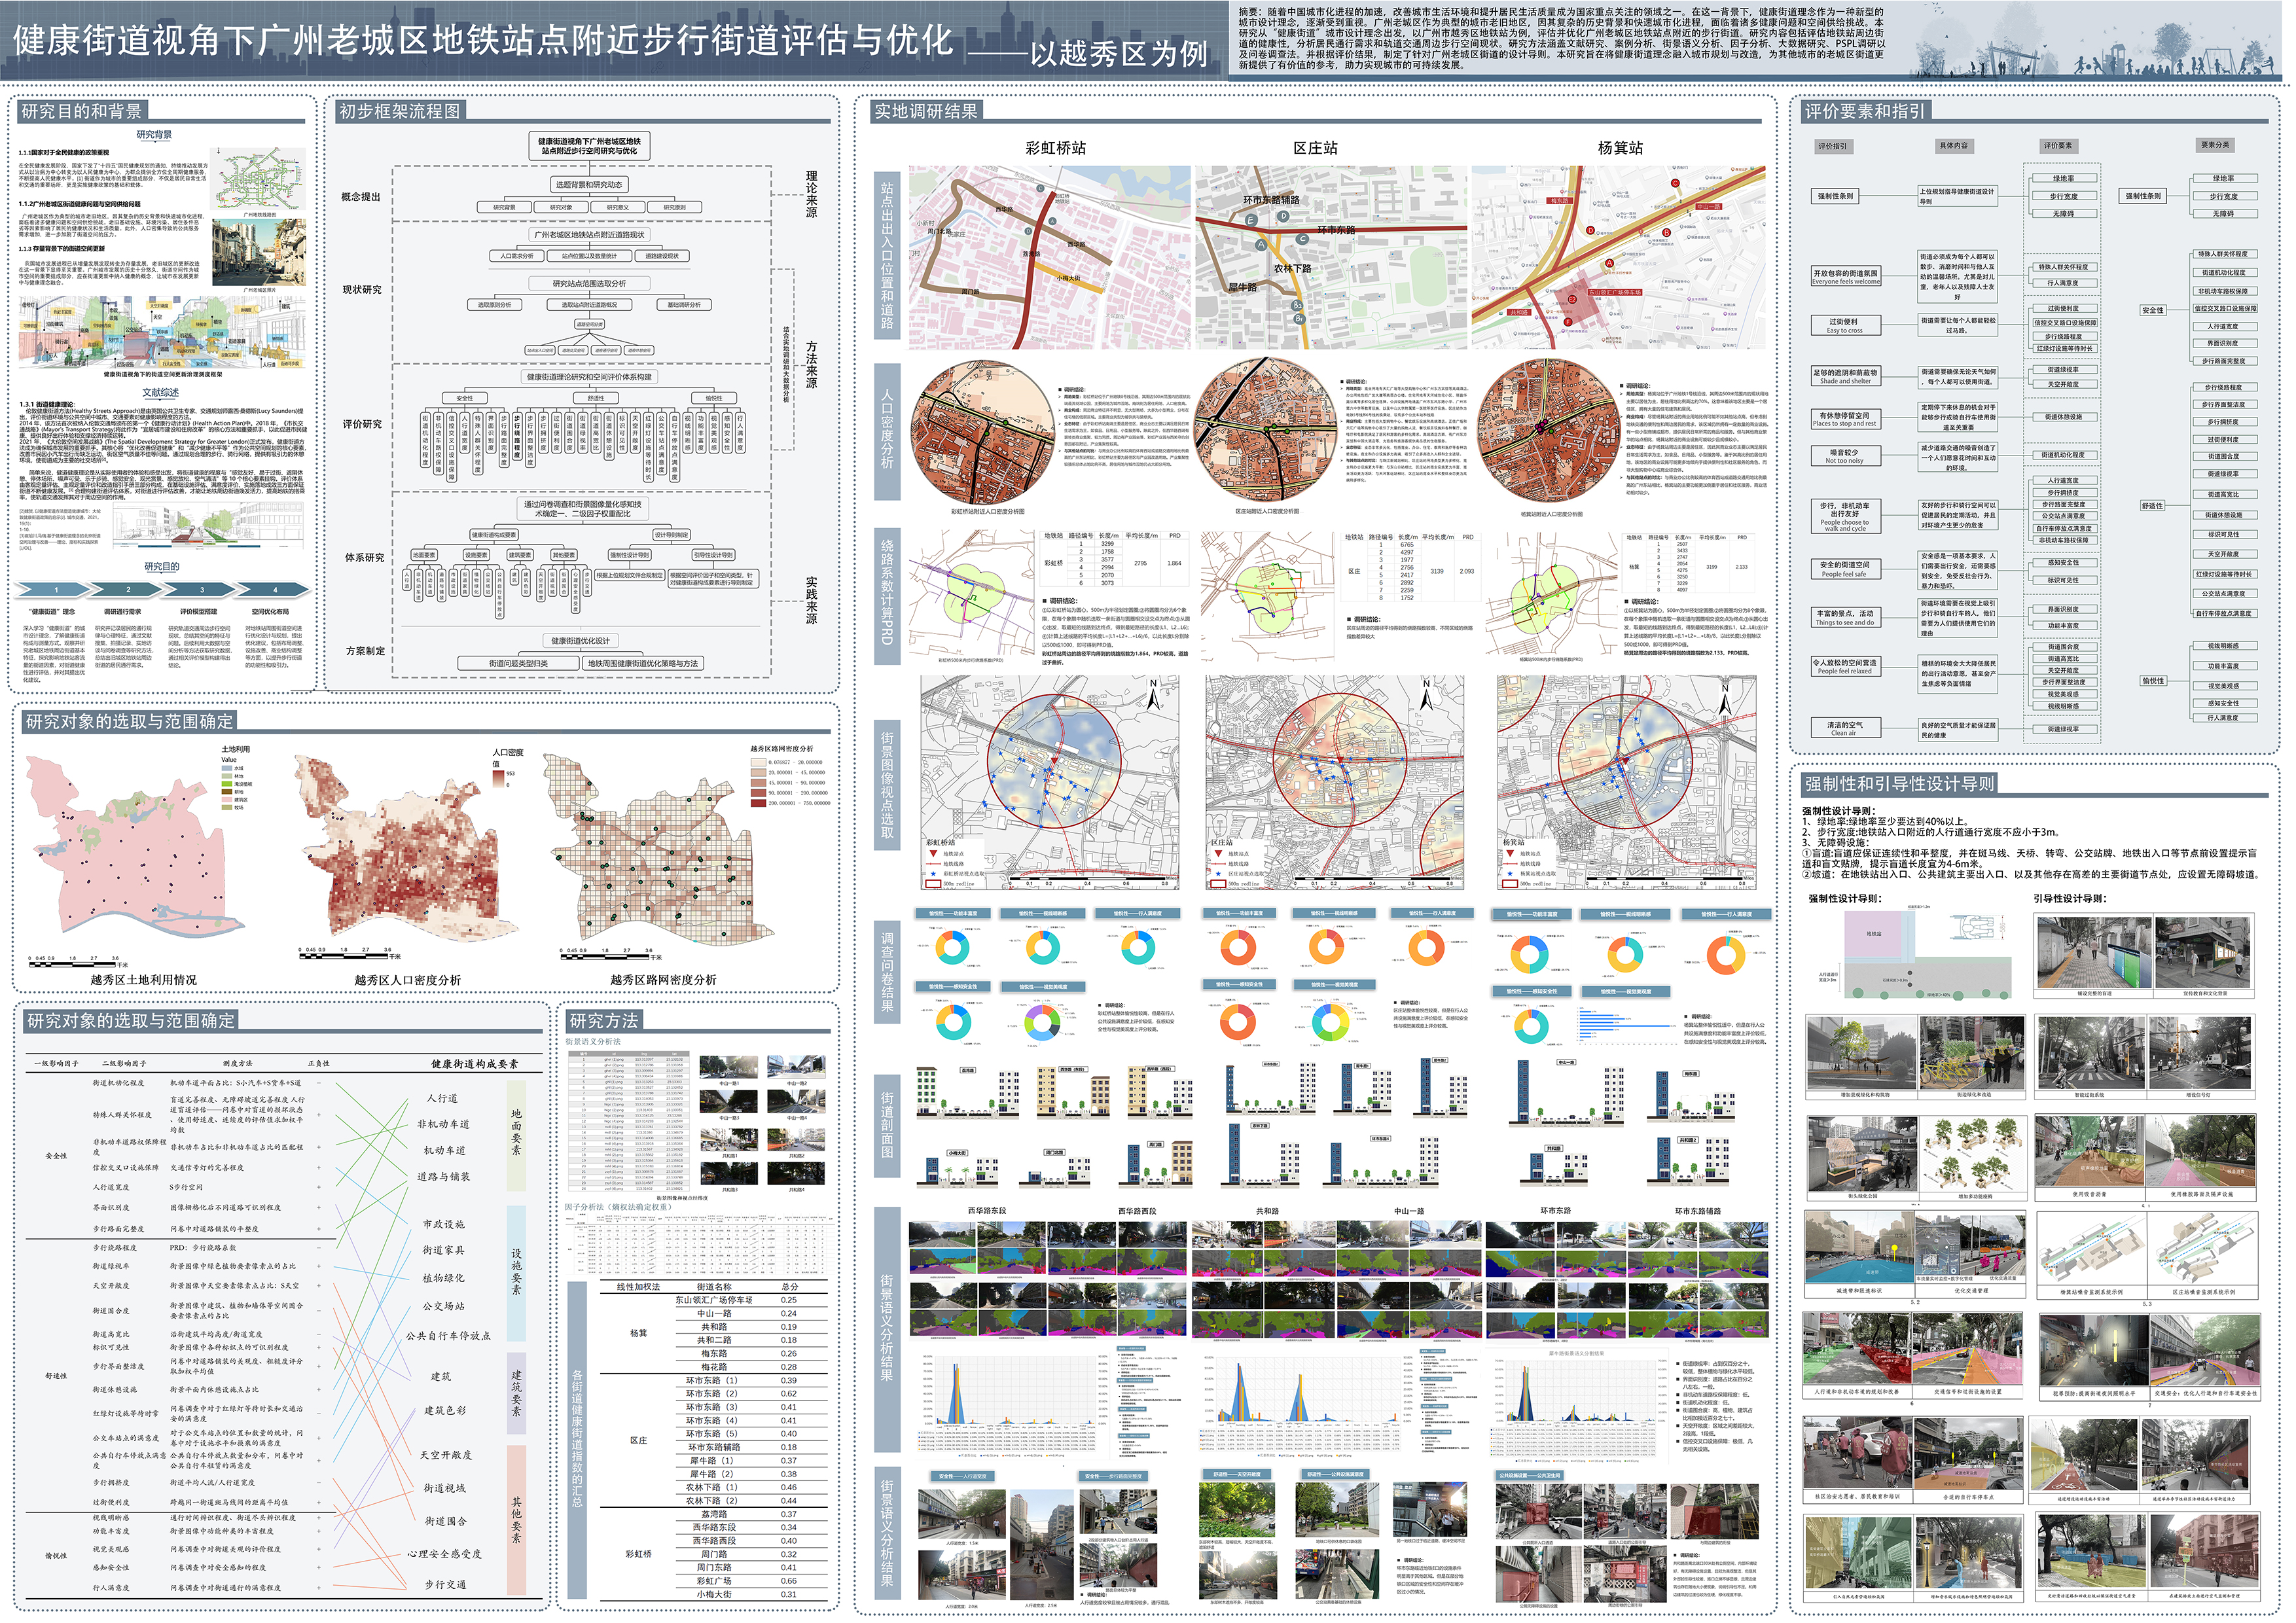
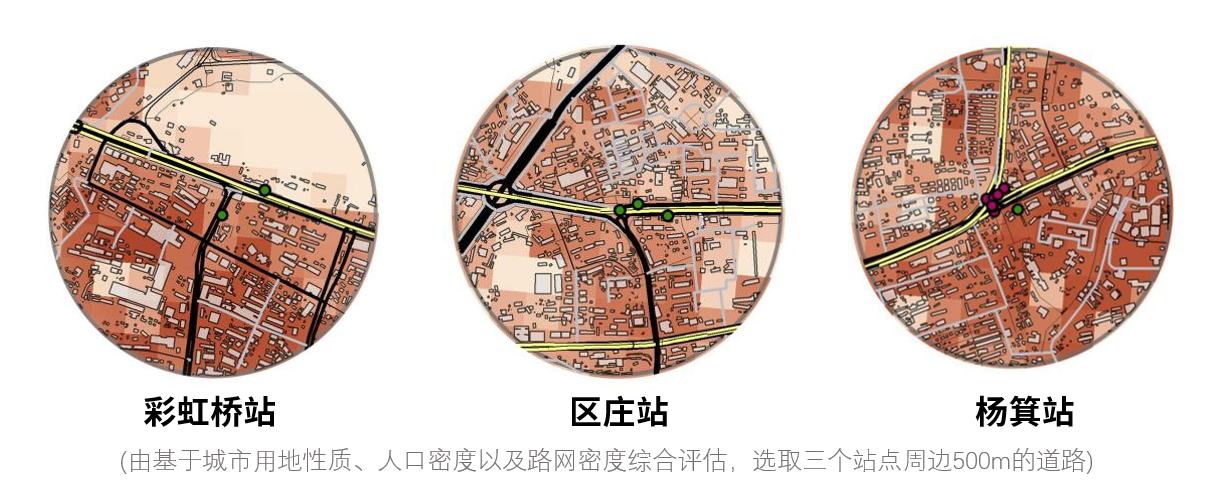
My core task was to build a complete "Spatial Data Quantitative & Evaluation Pipeline" from scratch. Based on GIS analysis of urban land use, population density, and road network density, I scientifically selected three core subway stations in Yuexiu District (Caihongqiao, Ouzhuang, and Yangji) as benchmark subjects. I connected the entire process from "large-scale spatial data sampling" to "deep learning streetscape pixel-level analysis", and finally to "mathematical model objective weighting & road network calculation". The ultimate goal was to accurately diagnose the street health index and precipitate scalable spatial optimization guidelines.
Data Mining & Business Guidelines Formulation
ArcGIS-Based Spatial Sampling & Big Data Calculation:
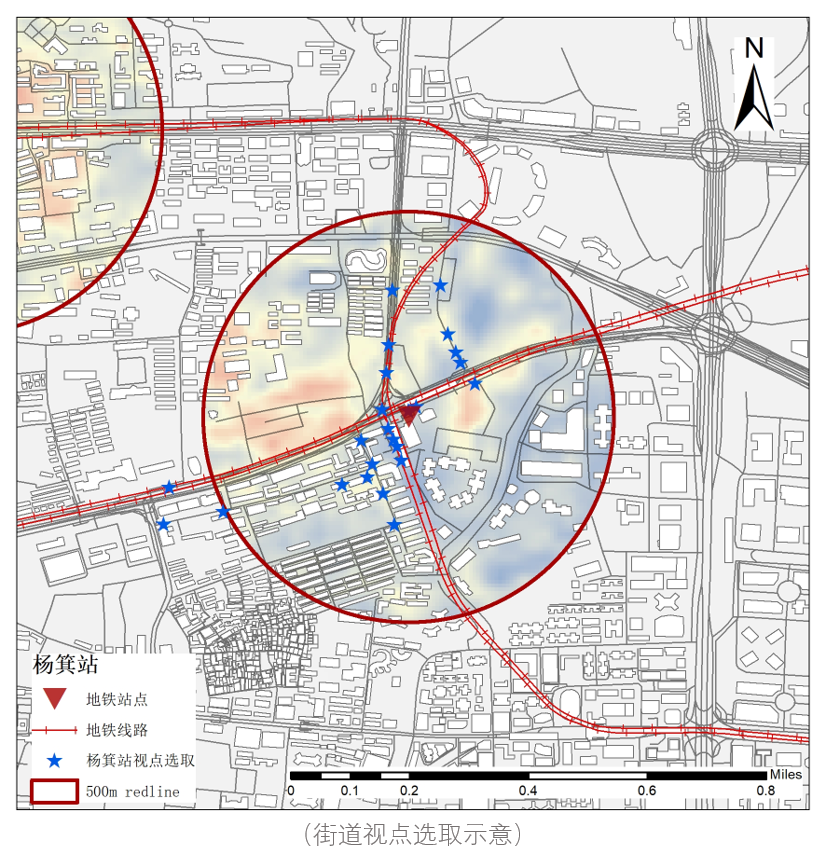
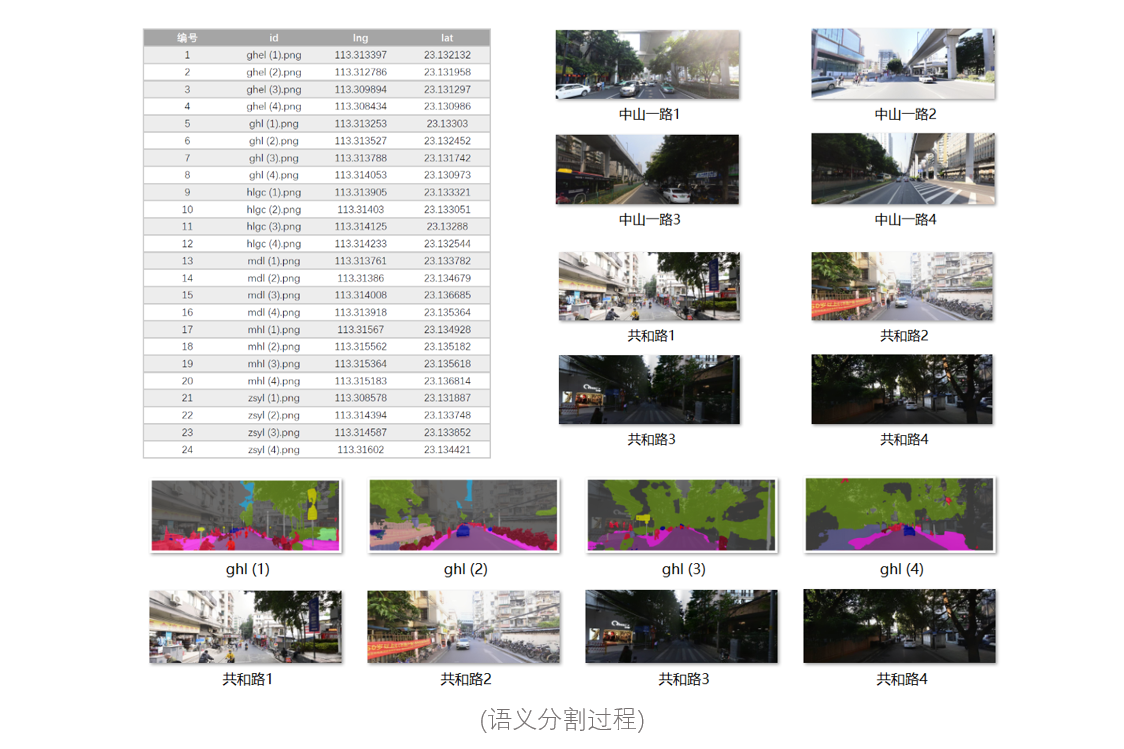
- Used Baidu Maps coordinate picking system to accurately obtain viewpoint coordinates, imported them into ArcGIS for spatial data visualization, and scientifically defined 68 streetscape collection points (covering mid-blocks and key intersections).
- Deeply utilized acquired POI data to perform Kernel Density Analysis in ArcGIS, scientifically defining and narrowing the research scope.
- Established a 1500m spatial buffer in ArcGIS, innovatively introducing eight-quadrant division and shortest-path algorithms to accurately calculate the PRD (Pedestrian Route Directness) of each station, providing hardcore data support for objectively evaluating subway spatial accessibility.
Deploying MXnet & DeepLab V3 via Python for AI Street View Semantic Segmentation:
- Independently configured underlying virtual environments using Anaconda, successfully deployed the MXnet deep learning framework, and efficiently executed core processing code within the PyCharm IDE.
- Successfully invoked the DeepLab V3 semantic segmentation model (pre-trained on the Cityscapes dataset) to perform size reconstruction and pixel-level computer vision recognition on a bulk batch of 68 Baidu panoramic street view images.
- Visualized 20 key street elements (vehicle lanes, sidewalks, buildings, plants, etc.) through color-block overlays with 0.8 opacity. Independently wrote functions to automatically extract pixel proportions for each element and export structured CSV data, successfully achieving a "dimensionality reduction" by transforming unstructured images into core quantitative metrics like Green View Index and Sky View Factor.
Data Modeling and Correlation Mining based on Entropy Weight Method and SPSS:
- Built a rigorous evaluation sample matrix, introduced the "Entropy Weight Method" to normalize and translate positive and negative spatial indicators (+0.01 to eliminate invalid data interference). By calculating information entropy redundancy, completely abandoned traditional subjective manual scoring, and accurately derived the absolute objective weight of each evaluation factor.
- Proficiently used SPSS statistical software to conduct in-depth bivariate correlation analysis between calculated PRD values and road network morphology evaluation indicators such as block edge length and intersection density, successfully exploring and confirming the deep mathematical laws behind road network textures.
Data-Driven Business Value & Iteration
Complete Data Model Validation & Precise Attribution:
Cross-compared the calculated health index scores with the actual built environments around Yangji, Ouzhuang, and Caihongqiao stations. The ground truth of high and low-scoring road segments highly aligned with the model's deductions, successfully verifying the scientific validity and business universality of this quantitative evaluation system.
Achieve Business Strategy Closed Loop & Value Delivery:
The design guidelines produced based on data insights effectively filled the industry gap in quantitative micro-renewal of healthy streets in Guangzhou's old urban areas. The solution not only implemented physical micro-renewal strategies but also deeply integrated historical and cultural heritage and community vitality into the spatial design, providing a data-driven decision model with extremely high commercial value for the stock renewal of old urban areas.
PM Deep Review & Long-term Iteration Planning:
During the project closeout review, keenly pointed out the current temporal limitations of combining qualitative and quantitative indicators. Forward-looking planning was made for the iteration direction of introducing dynamic time-series data such as dynamic pedestrian flow and real-time air quality index in the future; meanwhile, the core strategic significance of cross-disciplinary alignment (traffic engineering, public health) and the establishment of a long-term tracking automated evaluation mechanism was clarified.
Project Board